Create Stunning Visualizations with your GeoData Using Wijmo's JavaScript FlexMap Control
- Display points of interest with Bubble and Scatter maps
- Use Choropleth maps to show regional statistical values
- Customize your map's look with dynamic palettes
- Includes first-class Angular, React, and Vue support
Overview
A JavaScript charting component is a tool that to allows you to visualize data based on location in a web application. By using Wijmo's FlexMap using GeoJSON data, you are able to bind geographical feature layers and point layers in your app.
Why Choose Wijmo for Your JavaScript Map Component?
Three Specialized Map Types
Includes Bubble and Scatter Maps for plotting location-specific data and Choropleth Maps for plotting region-specific data.
Fast, High-Performing, and Lightweight
Engineered for top performance, FlexMap won't slow down your business apps-and at less than 200 KB; it will never bloat your applications.
JavaScript FlexChart Written in TypeScript
With TypeScript, you'll get an object-oriented C# feel, design-time error checking, and complete IntelliSense in Visual Studio.
Flexible and Extensible API
An extensive feature set won’t bloat the core component; it includes data binding, pixel-perfect SVG rendering & image exports.
Content Security Compliant
Wijmo is Content Security Policy (CSP) compliant, working seamlessly in JavaScript applications without compromising security.
JavaScript FlexMap Types
Bubble Map
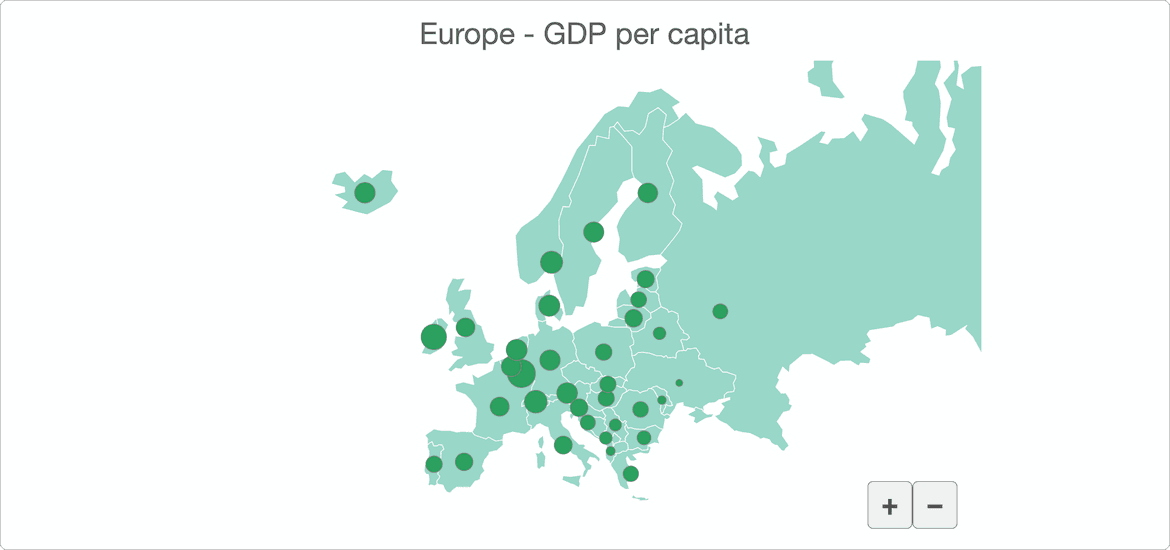
Bubble Maps can be used to display points of interest on maps and ascribes values to the points. The bubble's size depends on the value of the data (larger data = larger bubble).
Choropleth Map
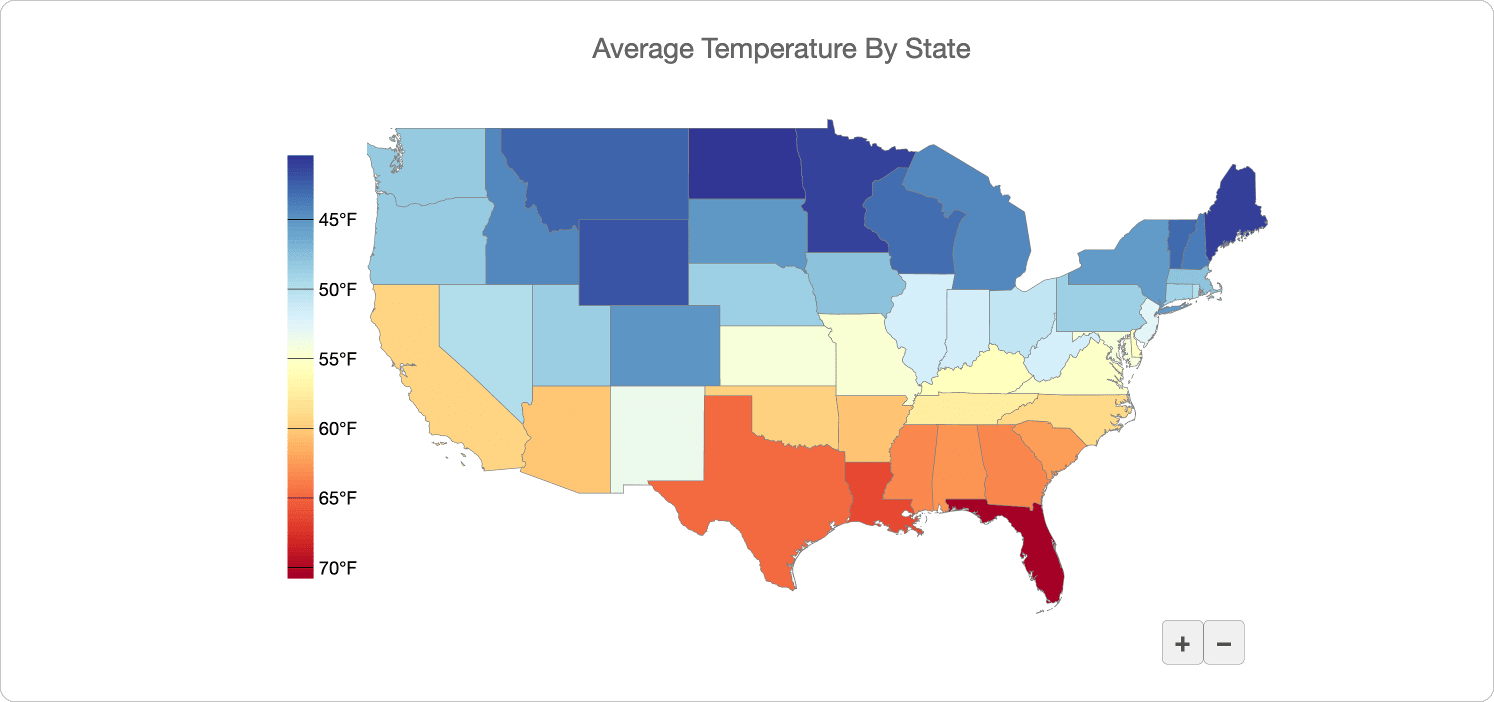
Display statistical values for geographic areas with Wijmo's JavaScript Choropleth Map control. Each area is colored based on the data that it represents.
Scatter Map
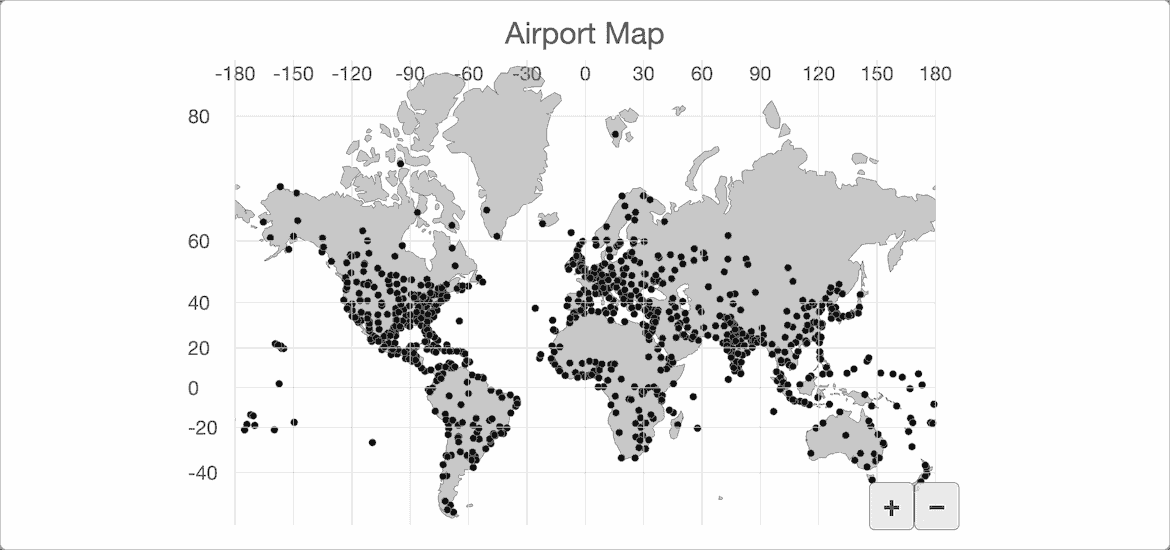
Wijmo's JavaScript Scatter Map control can be used to show points of interest. By using GeoJSON, you can plot points on the map and display information associated with those points.
Featured Blogs, Videos, and Other Resources
Trusted by the World's Leading Companies


