
Flexible WinForms Gauge Controls
Add linear and radial WinForms gauges to visualize your data in exciting and meaningful ways. ComponentOne Gauges for WinForms includes:
- Radial and linear gauge controls that can be designed without writing any code
- Create a simple gauge or a fully custom gauge using the extensible API
- Add markers, indicators, ranges, and animation to embellish your dashboards
Why Choose Gauges for WinForms?
Create Dynamic Dashboards
Gauges add a unique style to your business dashboards. Bring your data visualizations to life with eye-catching and interactive gauges.
Code-Free Development
The WinForms gauges can be built completely code-free at design-time. Double-click any part of the gauge and an editor will open to help you quickly set properties.
Get Started Quickly
Get started quickly by choosing from more than 70 pre-designed templates. You can also create, save, and reuse your own templates for easy reuse.
Easy Data Binding
Create gauges that can be easily data-bound using standard .NET data-binding techniques. You can even bind individual pointers to different data sources.
Scalable & Pixel-Perfect
The WinForms gauge control supports vector-based graphics so the gauge paints itself perfectly in any size, and all inner elements resize proportionally.
Extremely Customizable
Build designer grade WinForms gauges that look like a graphic designer made them! The deep API enables extensive customization.
Types of WinForms Gauges
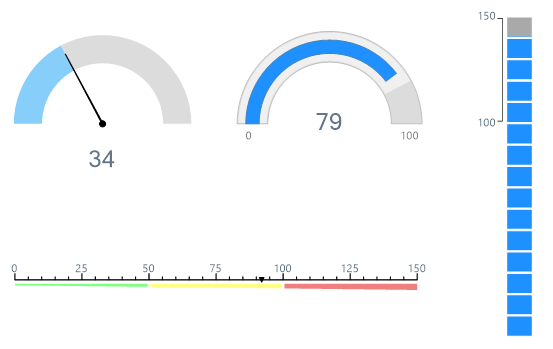
Radial and Linear Gauges
You can use the WinForms gauge control to create simple radial and linear gauges. Radial gauges can be circular, helical, arc curve, clamshell, or half-circular. Linear gauges can be horizontal, vertical, or tilted. Both gauges support traditional pointers and filled ranges.
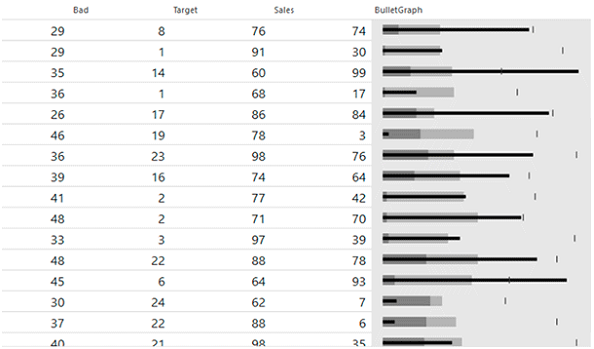
WinForms Bullet Graph
Create a bullet graph designed specifically for use in dashboards and information screens. It displays a single key measure along with a comparative measure and qualitative ranges to instantly signal whether the measure is good, bad, or in some other state.
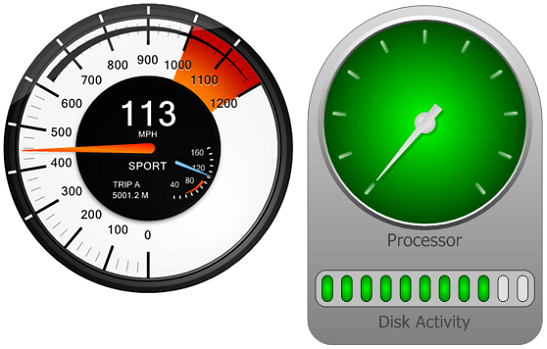
Complex and Composite Gauges
With its deep and flexible API you can create complex and beautiful gauges. Combine multiple gauges into one using the WinForms gauge control. Gauges can be overlapped or placed side-by-side. Customize every precise detail to get the exact visualization design you want.
WinForms Gauges Key Features
Set Bound Ranges
Add any number of non-linear and linear-shaped ranges. You can customize the exact location, style, and size of the ranges to best suit any desired look. Map colors to value thresholds to display multi-colored ranges. You can even bind ranges to moving pointers for a more dramatic display or to create thermometer and progressbar-style gauges.
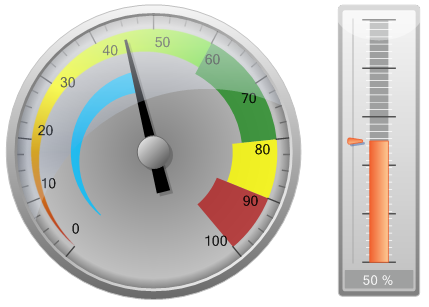
Add Markers
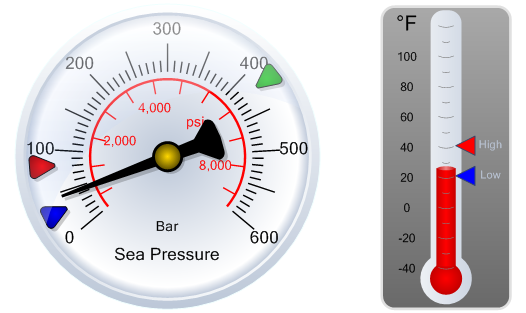
Markers — visual cues that can be placed at specific values on the gauge scale — are useful for comparing the gauge value to some other predetermined or data-bound value. Customize their look and positioning to fit any desired look.
Multiple Pointers and Scales
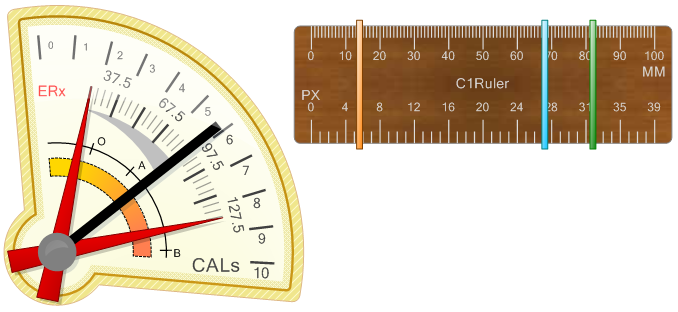
There is no limit to the number of pointers and scales one gauge can hold. You can add multiple, related scales to one gauge, or overlay multiple gauges for disjointed scales. Scales can be non-uniform: linear or logarithmic. It's also possible to create dynamic scales. You can bind the beginning and ending of a scale to pointers.
Interactive Input
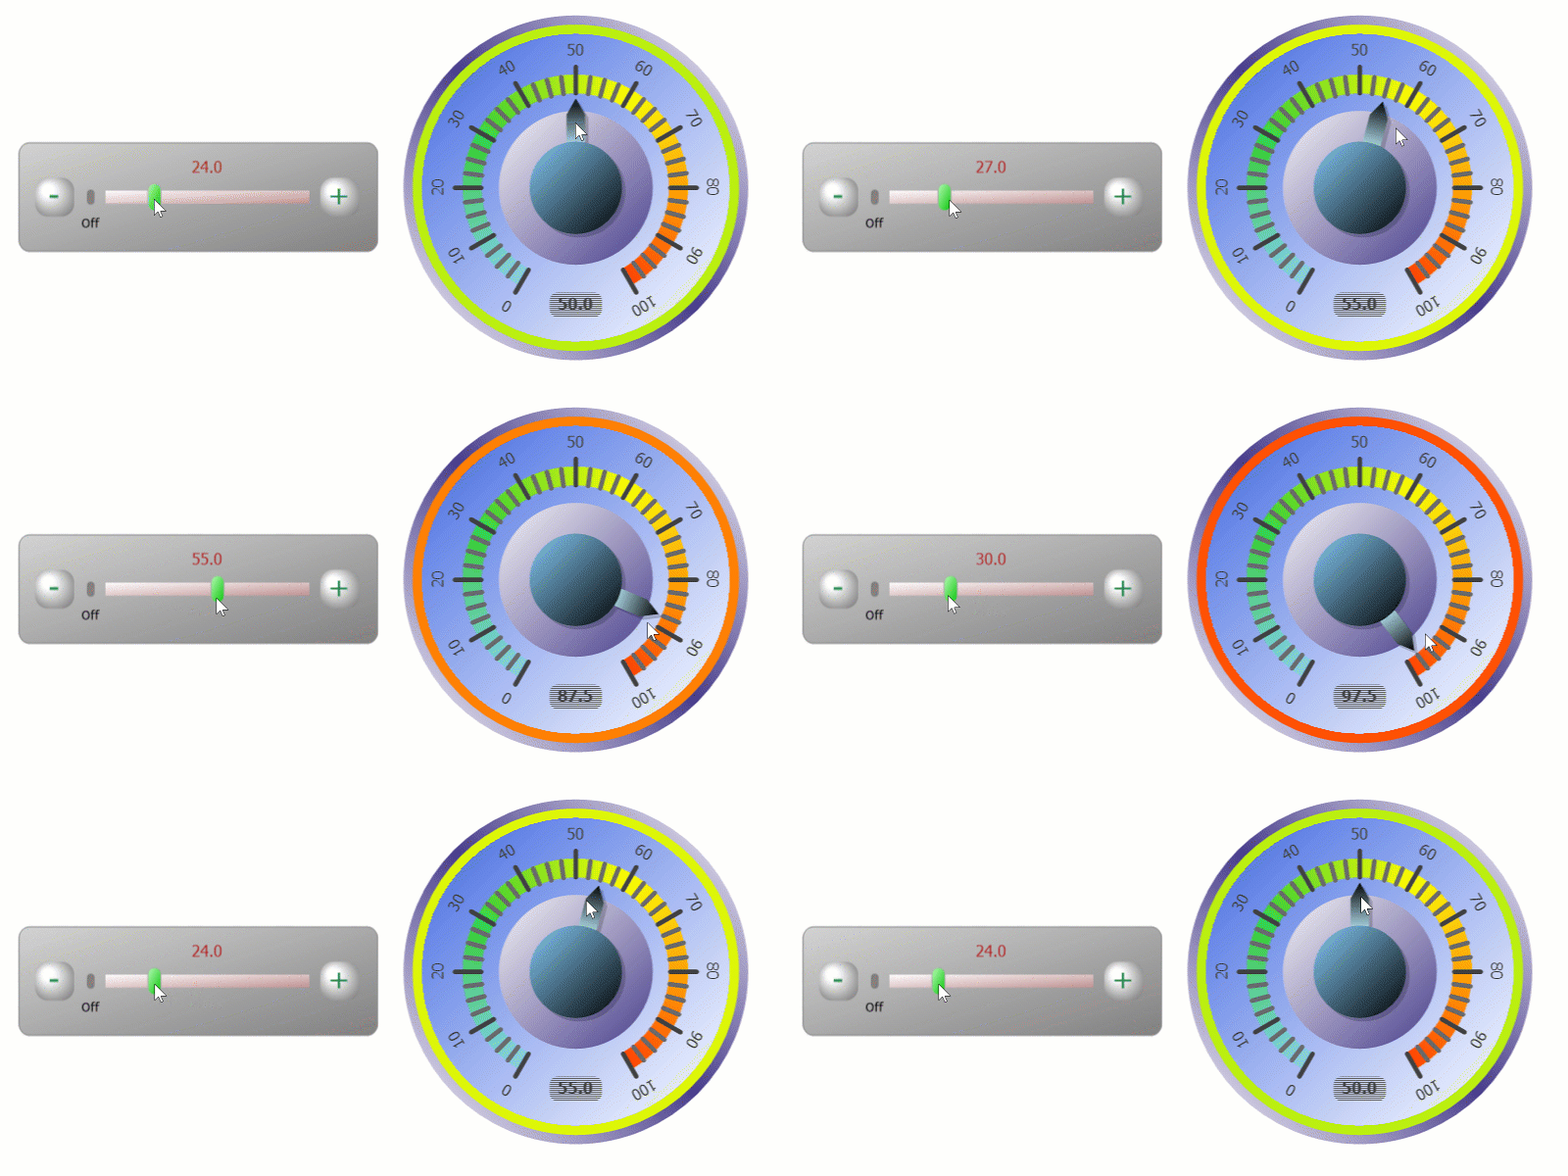
Interactive features allow you to use the WinForms gauges for data input. For example, add gauge buttons within the gauge's design to allow users to change values. Gauge pointers can also be dragged at run time with the mouse while optionally snapping to set intervals along the scale.
Additional Features
Dynamic Indicators
Display indicators that change based upon the gauge value thresholds using bound labels and markers. For example, the background color of a marker can dynamically update based on the pointer value.
Pointer Customization & Animation
Enable animation so the gauge pointer will animate smoothly as the value changes. Choose from many predefined pointer shapes, customize the shape, or import an image to use as the pointer. You can also make the pointer interactive.
Vector-based Graphics
All graphics are vector-based in unless you specify the pixel-based size, enabling the gauge to paint itself perfectly in any size while all the inner elements resize proportionally.
Flexible Data Binding
Bind the WinForms gauge control to a data source at design-time using standard .NET data-binding techniques. You can bind up to five individual pointers to different data sources.
Smart Labels
The radial gauges can automatically rotate labels to make them more readable to users. Add bound labels to display the gauge value. Format gauge labels and value indicators to display as percentages, currency, and more.
Save and Reuse Templates
In addition to 70+ gauge templates to get started, you can save and reuse gauge templates. You can also save your WinForms gauge to an XML file to reload at a later time.


